McKownville
Improvement Association
- groundwater variations north of Western
Avenue
Record of groundwater level from only one monitored
well
The groundwater levels in McKownville fluctuate, depending on rates
and amounts of precipitation received, and of surface runoff,
evaporation, plant and tree transpiration, and flow in the
unconfined sand aquifer to the local creeks. While there are a few
private wells in the area, the overall amounts extracted and the
effects of these are likely to be small; the University claims not
to be extracting any groundwater for the fountains or field
irrigation. Because there is only one monitoring well in the area
with a long-term and reliable record, there are limits on what can
be concluded as to the relative influence of all possible causes of
the fluctuations. The record for this USGS well A-654 near Alumni
House on the University at Albany campus suggests that local
precipitation, and its infiltration, is usually the major control,
but there are anomalies at some times in the record that can
not be explained simply by direct precipitation infiltration as a
prompt input.
Spring to fall drawdown
Looking at the record of the most recent year (2024) as a starting
point, it contains an excellent example of significant and
consistent drawdown of the water table from late spring (mid-April)
to later summer (early August); from a high of around 5.8 feet below
the surface, to a low of about 8.7 feet below. There are three small
reversals in this interval lasting a few days, directly caused by
precipitation events, one in early May, and three events in June;
these are rises of 0.04, 0.04, 0.21, and 0.03 feet (0.5, 0.5, 2.5,
and 0.4 inches) over 1 to 3 days, after which the steady drawdown
resumes. Precipitation for these four events was 1.24, 1.56, 1.33,
and 0.46 inches recorded at the Albany airport weather station;
there was a lot more rain locally in the third event as there was a
deluge associated with a thunderstorm and this caused significant
flooding on Western Avenue at Fuller Road. Mike Wren's records from his
McKownville.com weather station give precipitation of 1.12,
2.38, 3.81, and 0.53 inches for these events.
What happened in August? From 2 to 9 August 5.7 inches of rain fell
at the airport (7.17 recorded in McKownville), with more than 3
inches of this total in the last two days of this interval. The
water table rose 1.12 feet, about double the amount of local
precipitation. Another significant precipitation event occurred
18-19 August, with local precipitation of 2.2 inches recorded at the
airport (4.15 inches in McKownville); the water level in the well
rose 0.47 feet (5.6 inches) over the next four days. Then, the
summer drawdown resumed, in the absence of any further substantial
precipitation, the rate declining into October as average air
temperatures, and transpiration from trees, decreased.
Infiltration to the local aquifer near the well appears to result in
the water table rising proportionately more for large compared with
smaller precipitation events.
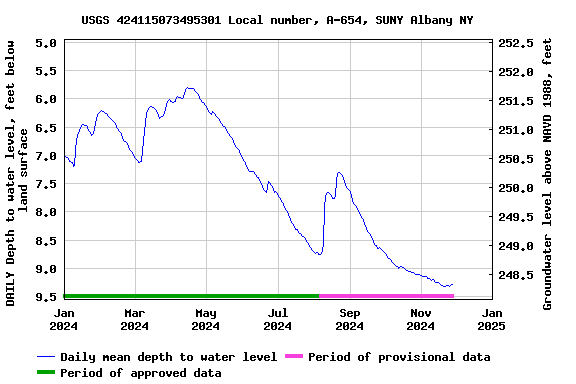
Water depth record for 2024 to 28 November in USGS monitoring well
A-654 near Alumni House on the SUNYA campus
well depth charts and data on this page sourced from:
https://waterdata.usgs.gov/nwis/uv?site_no=424115073495301&legacy=1
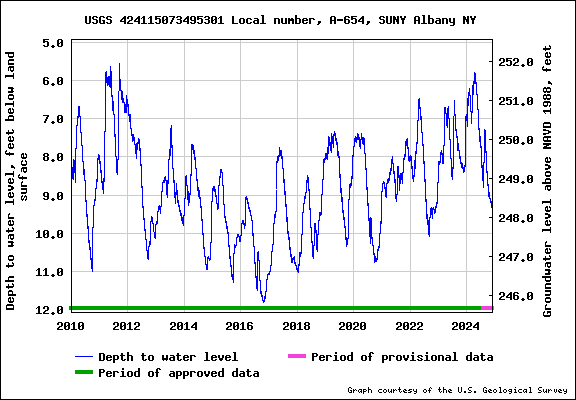
Water depth record for the interval 2010-01-01 through 2024-11-27 in
USGS monitoring well A-654 near Alumni House on the SUNYA campus
showing the range of water table depth variations over this 14 year
interval, from a maximum depth of nearly 12 feet to a minimum of
near 5.5 feet.
Fall to spring recharge
Most of the yearly records show a rise in the water table from late
fall or early winter to the spring of the next year, the primary
causes being low evaporation during the interval of low surface
temperatures and no significant transpiration by trees and other
vegetation. This can be seen in the multi-year record on the graph
above. The amount of recharge varies; for instance the decline in
maximum, minimum, and average well depths from 2011 through 2016
corresponds to generally lower than average overall precipitation,
and the general increase since then (except for 2020 and 2022) to
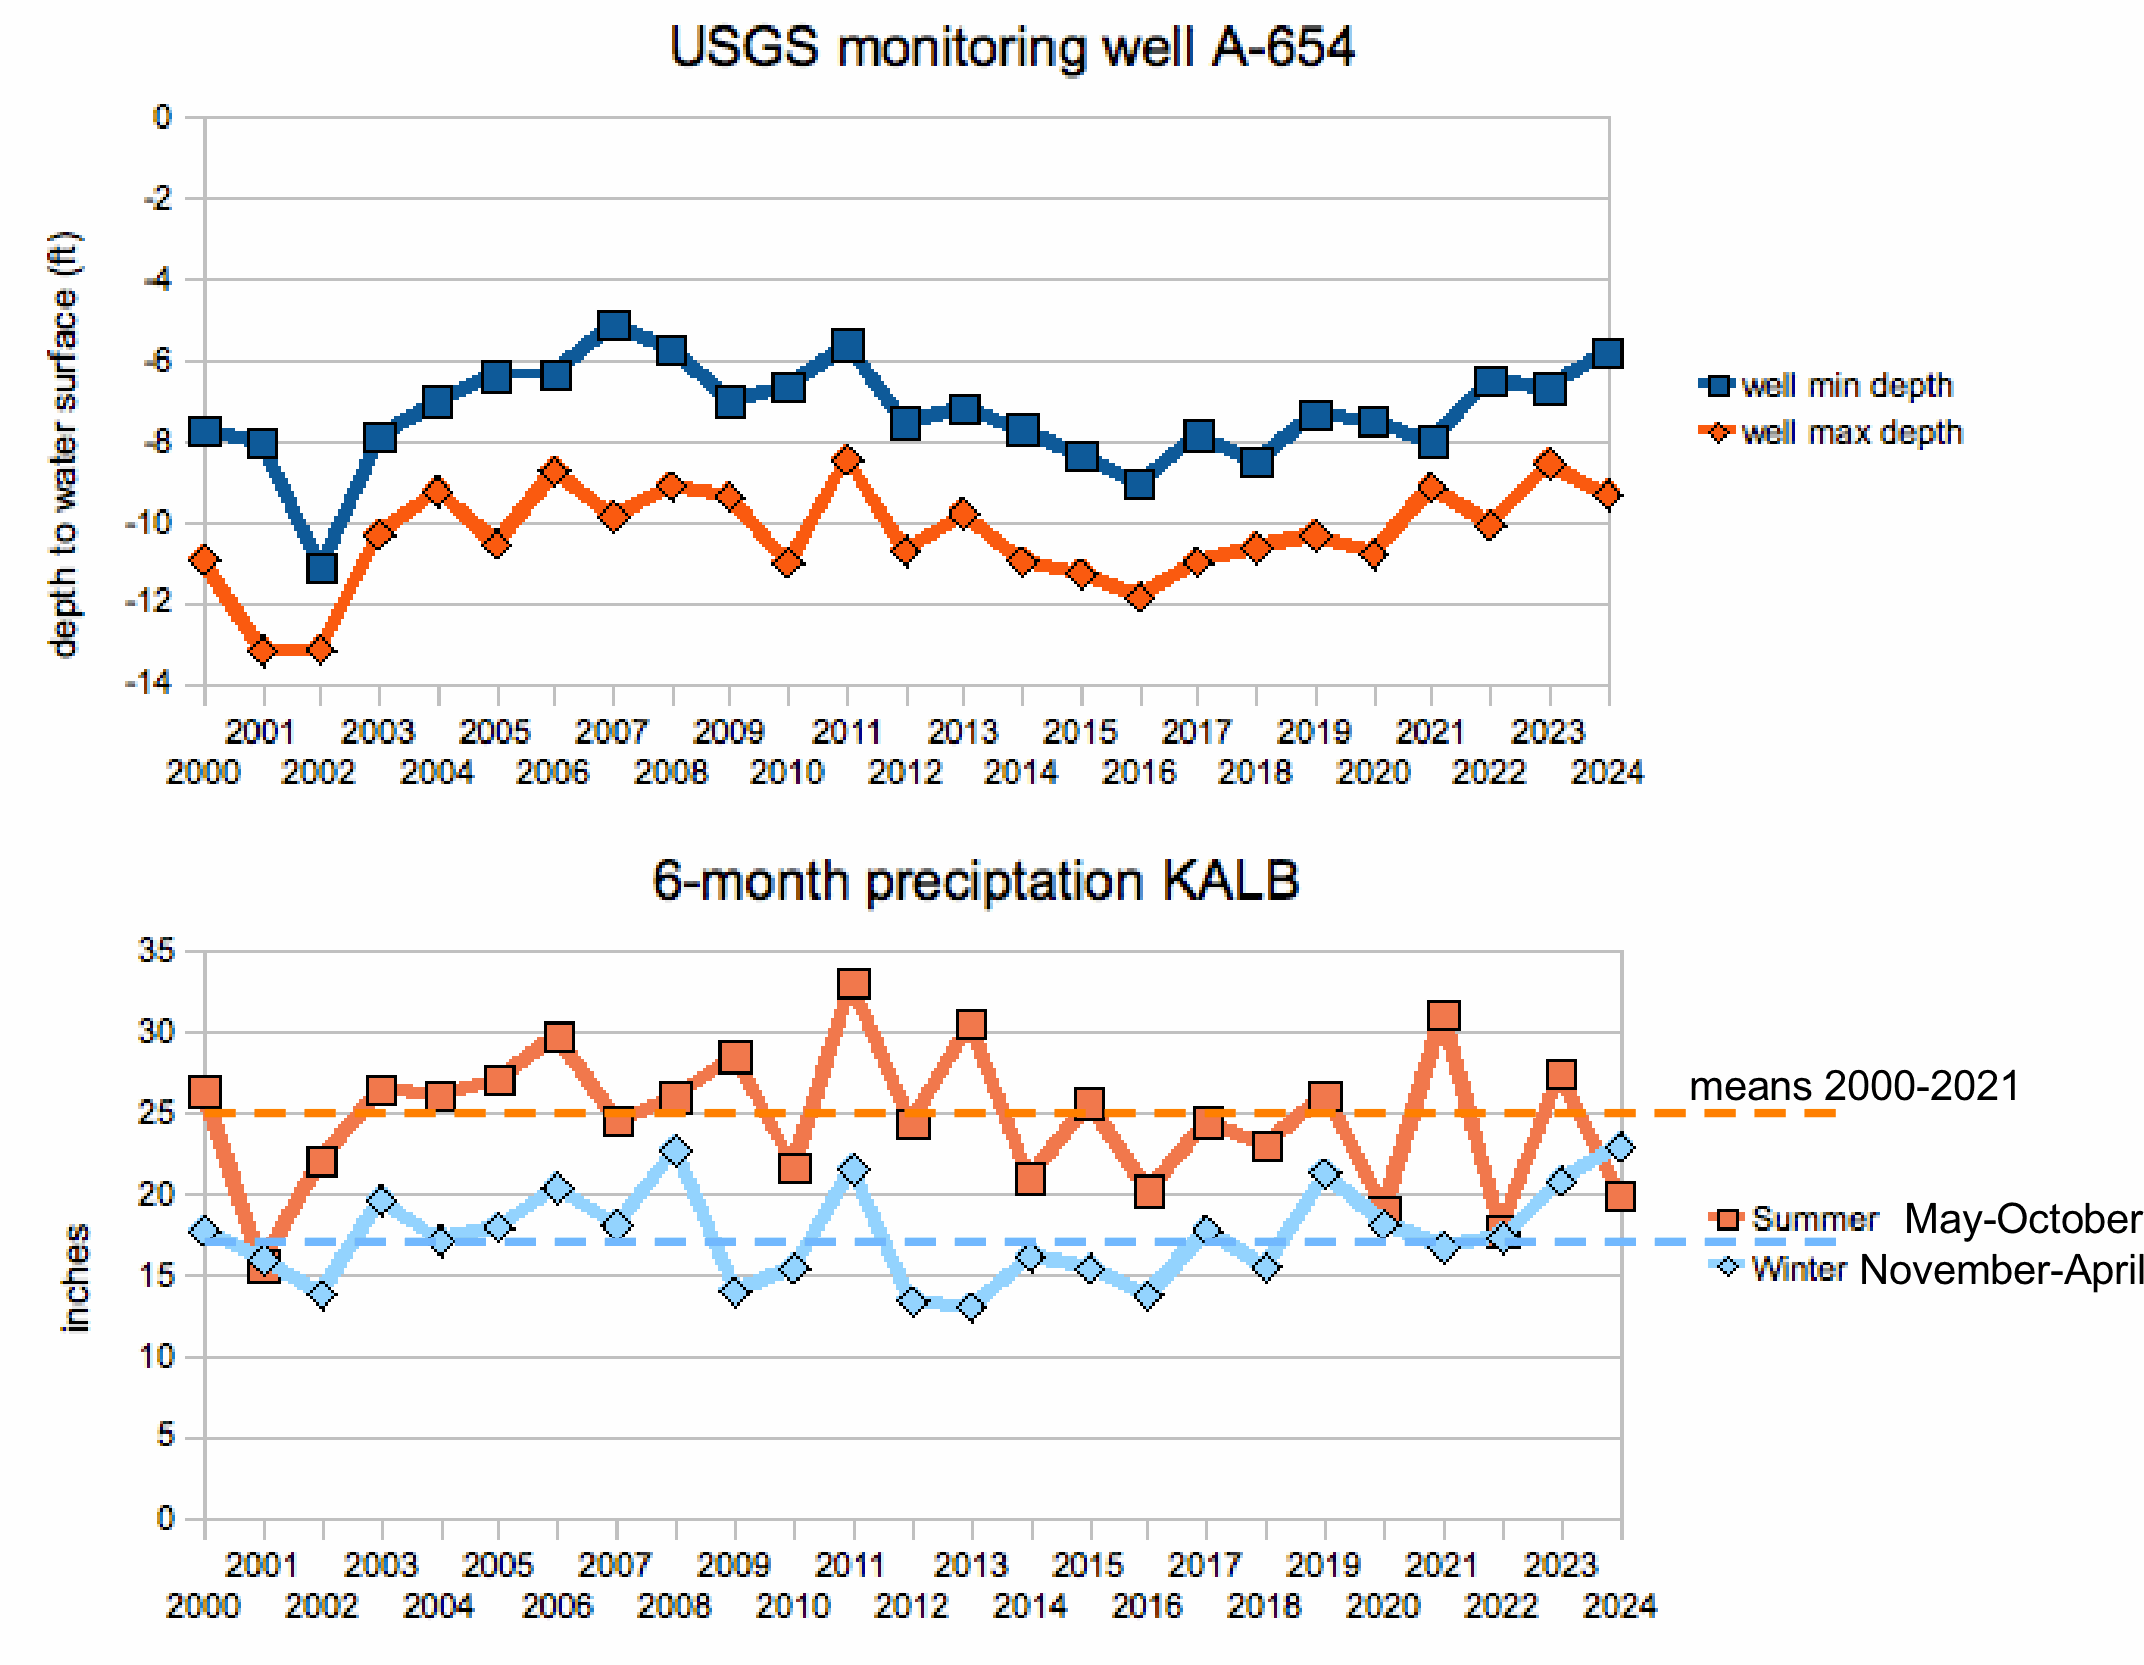
increased overall precipitation. To support this conclusion, the
charts below show the 6-monthly interval precipitation records since
the year 2000, and the minimum and maximum water depths in the
monitoring well record for these two time intervals each year.
The rate and total amount of recharge in the late fall to early
winter is rapid and large in most years (and substantially more than
expected from the precipitation and direct infiltration in this
interval), as shown in this example of the well depth record from
late 2018 to mid 2020.
The source of this substantial late fall and early winter inflow is
not clear.

The map below shows the area and local
topography with 2ft contour interval, and the general inferred
directions of groundwater flow away from the drainage divide(s).
The nearby wetland north of the western parts of Mercer and Warren
Streets indicates that there is a perched water table in this area,
on a thin clay layer within the sands. Underground spillage to the
east from the edge of this feature might provide a reason for
anomalies in recharge pattern at the monitoring well. The flow from
this possible source would cross through the site of the new large
apartment blocks at the west side of Fuller Road, and the
construction of the foundations of these large buildings, and
infiltration storage under the parking areas, could have made
significant changes to the groundwater flow compared with the
situation of the previous low-density residential use of this area.
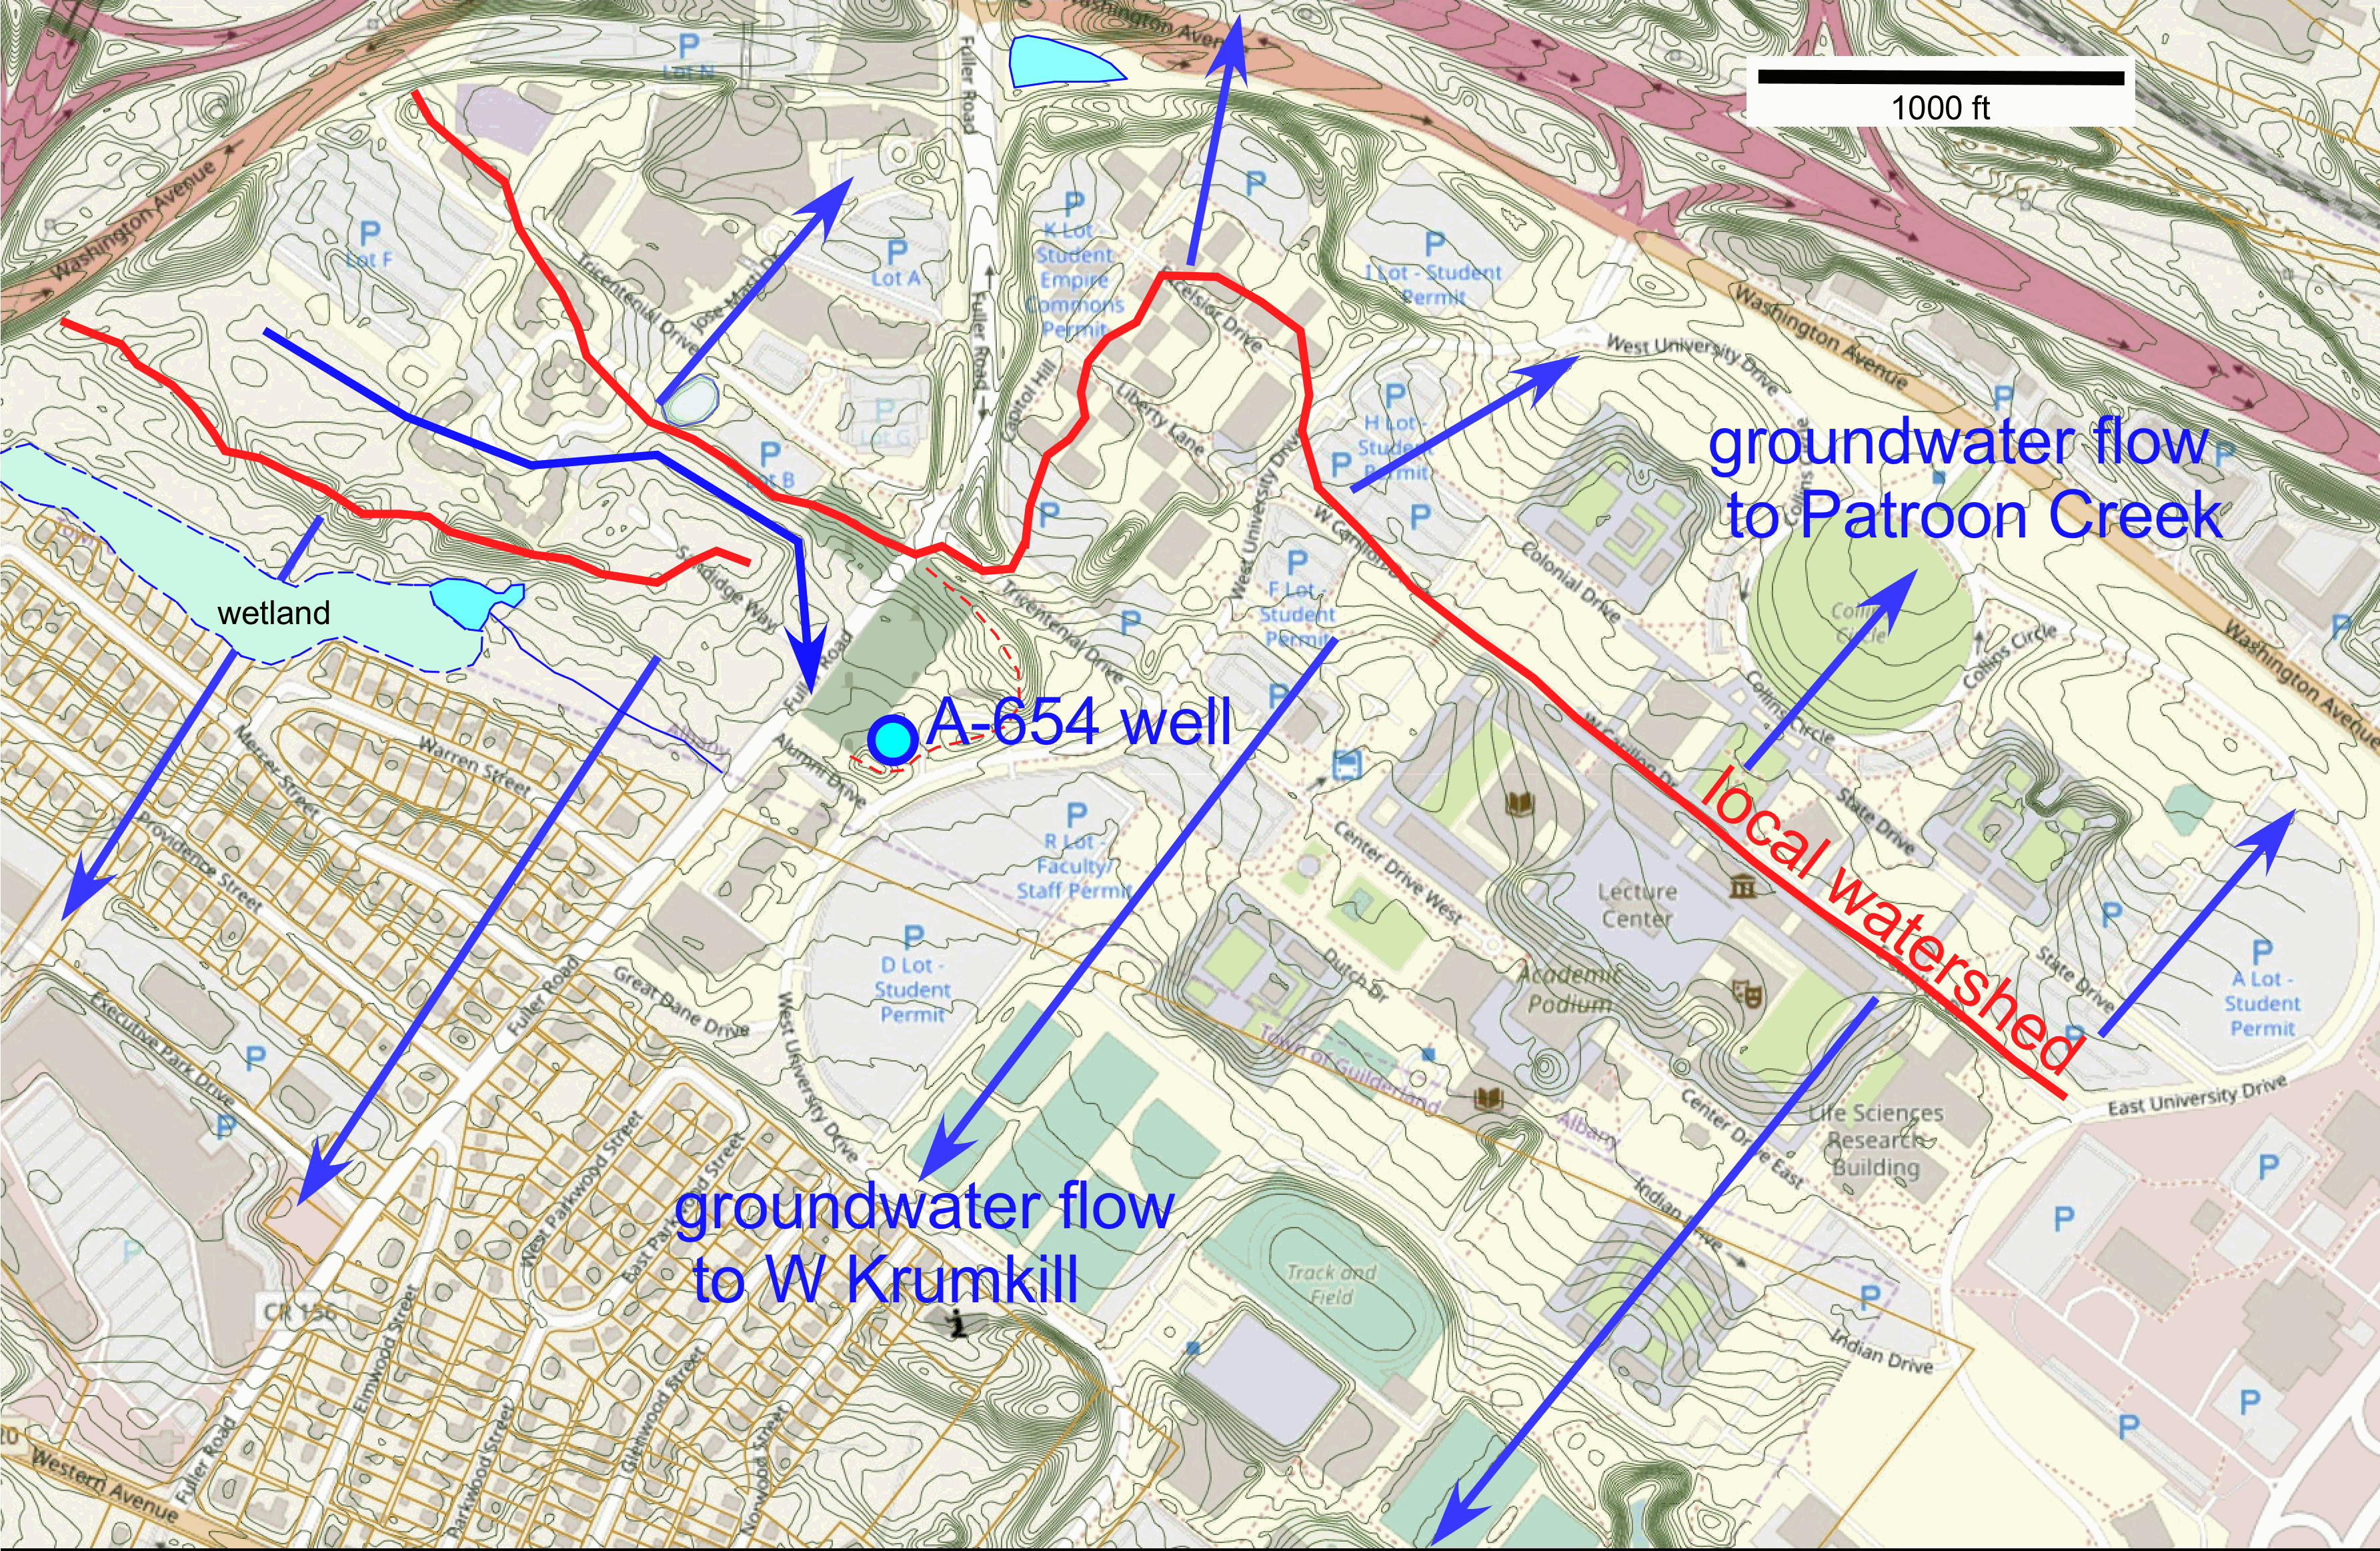
map of west SUNYA campus area and adjacent McKownville
showing local watershed lines and inferred general groundwater flow
directions
base map sourced from Town of Guilderland online Interactive
Mapping site:
https://ny-guilderland.civicplus.com/398/Town-of-Guilderland-Interactive-Mapping
[topographic contours at 2 ft interval on this map were
derived from lidar imaging]
return to McKownville groundwater
page